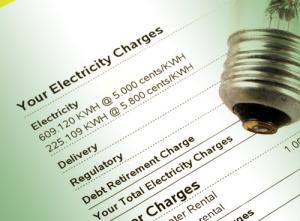
Average monthly electric bills are quite different depending upon where you are in the country. According to the very best analysis of what Americans spend their money on, the Consumer Expenditure Survey, residential electric bills averaged $145 in the south, in 2021. But they averaged significantly less elsewhere.

The other regional averages were all within a considerably lower six-dollar range. $117 in the midwest. $118 in the west. $123 in the northeast.
That tells only part of the story. Yes, southerners have higher electric bills on average. That’s because they count on electric utility service to cool their homes for much of the year. Much more so than households in the other regions.
Most midwesterners, northeasterners and westerners count on natural gas utility service to warm their homes for much of the year. That’s atypical in the south. As a result, tens of millions of households in the south pay relatively high electric bills, averaged over the course of the year, while they pay relatively low natural gas bills.
This essay has already used the word average a half dozen times. It’s important to remember that averages mask meaningful distributions. Electric bills are all over the place, widely distributed regionally, seasonally, and by household income, age, type of home, etc.
The average electric bill in the west is $118 as we said. $3.93 a day. Yet a household living in a Seattle apartment is likely paying much less than that average. Maybe as low as $2.50 a day or less.
A household living in a large single-family house in Vegas is likely paying much more that that average. Maybe as high as $5.50 a day or more.
Largely because of the contrast in the climates of Seattle and Vegas. Living in Vegas means you’re running the AC a lot. Certainly, more so than in Seattle.
The wide distribution of the electric bills that households pay is important to understand because of the wide distribution of households’ ability to pay. For instance, Mississippi households spend less per capita on all goods and services in total than do the households of any other state. But, as we said above, southerners in general spend more on electricity than elsewhere in these United States. This implies that, for a relatively large proportion of Mississippi households, their electric bills take up quite a significant slice of their home budgets.
At the other end of the spectrum, there’s Massachusetts. Households there spend more per capita on all goods and services in total than do the households of any other state. And, as we said above, northeasterners in general spend considerably less on electricity than do southerners. This implies that, for a relatively large proportion of Massachusetts households, their electric bills take up a somewhat thin slice of their home budgets.
Of course, there are wealthy households in Mississippi as well as poor households and everything in between. As there are in Massachusetts. As there are in any of the states. So, the distribution of electric bills as a percentage of household ability to pay is very wide indeed across the country and within every of its states.

