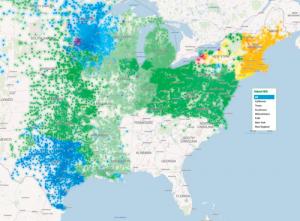
U.S. Grid Realtime Heatmap
Steve Mitnick is President of Lines Up, Inc., Editor-in-Chief of Public Utilities Fortnightly, and author of “Lines Down: How We Pay, Use, Value Grid Electricity Amid the Storm.”
We couldn't take our eyes off of the realtime heatmap of the continental U.S. grid. It was fascinating how it evolved during a recent afternoon, with different colored dots demonstrating price disparities between the grid's numerous nodes — generating stations, load centers and the like.

So naturally, with our curiosity aroused, we wanted to know more. So the Clarity Grid Solutions folks walked us through how one can dig deeper and apply the data they've laboriously gathered to problems of utility regulation and policy.
In these five steps, they unfolded the electric grid for us, drilling down all the way to the price dynamics in a neighborhood. Just one of the ways one can apply this extensive database of the wholesale and retail costs of electricity.


