
State Data
On average, across all the households in a state, in 2023, residential energy in Mississippi took up a larger percentage share of consumer expenditures, 2.42 percent, than in any other state. At the other end of the scale, residential energy in Washington State took up a smaller average percentage share, 1.25 percent, than in any other state.
Excluding the District of Columbia, where the average residential energy share was even lower. The all-urban District is understandably an outlier.
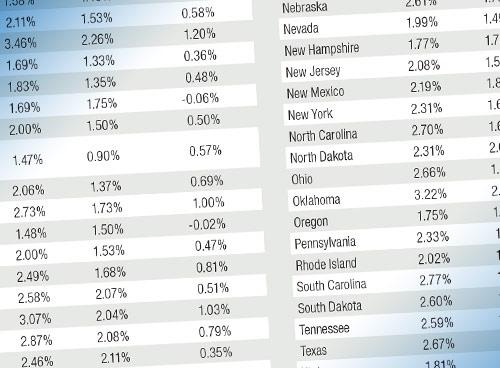
Figure 1 shows the average residential energy share for every state. Download the figures in pdf format here.
For this analysis, we total what households spend for both electric utility service and natural gas utility service to make the percentages more comparable. States vary considerably in how much their residents use electricity or natural gas for space heating particularly.
The states with the largest average residential energy share tend to be in the South and Midwest, where average income is below the national average, where the proportion of households in rural and single-family houses is above the national average, and where the climate calls for more air conditioning in the summer or heating in the winter. On the other hand, the states with the smallest average residential energy share tend to be in the Northeast and West, where average income is above the national average, where the proportion of households in rural and single-family houses is below the national average, and where the climate calls for less air conditioning in the summer or heating in the winter.
Of course, these numbers are state averages. The averages mask the wide differences within a state, especially between households with low incomes and those with high incomes.
For example, in that same year of 2023, the twenty-seven million U.S. households with the lowest incomes spent as much as 4.7 percent of their consumer expenditures on residential energy, on average. But for the twenty-seven million households with the highest incomes, they spent just 2.1 percent of their consumer expenditures on residential energy, on average.
Back to the state averages, which have been decreasing over the years. In other words, on average, without respect to income and other differences within a state, residential energy has been trending to be more affordable.
Figure 2 shows the change in average residential energy share for every state from 1997, when this data became available, to 2023. Download the figures in pdf format here.
All but two states saw a decrease, and generally saw a substantial decrease, in the average residential share over the last quarter century. For instance, the average residential energy share in Louisiana fell from 3.43 percent in 1997 to 2.13 percent in 2023.
This means that on average, residential energy became more affordable in the Pelican State. Though, undoubtedly, there are many low- and moderate-income households there that are struggling with making ends meet.
Affordability by the Numbers articles at fortnightly.com:
