
Price Tag in Customer Rates?
Branko Terzic, Sc.D. Engineering (Hon.) is a former Commissioner on the Wisconsin Public Service Commission and the Federal Energy Regulatory Commission. He also was Chairman, President and CEO of a regulated utility and holding company.
R. Bruce Williamson, PhD. is Senior Fellow, Public Utility Research Center at the University of Florida. He was Commissioner with the Maine Public Utilities Commission following a career in energy and utility markets and telecommunications in the U.S. and internationally.
This continues our analysis of future electric transmission requirements based on the 2020 Princeton Net Zero (PNZ) report, which findings have found their way into official Department of Energy press announcements related to the 2023 Inflation Reduction Act.

The PNZ research found the net zero target will require that U.S. electricity transmission systems expand "~60% by 2030 and may need to triple...by 2050" to connect wind and solar facilities to demand. In percentage terms, tripling is a two hundred percent increase. The cost estimates for total capital invested in transmission are "$360 billion through 2030 and $2.4 trillion by 2050."
In Part I, we reviewed the history of electric transmission expansion from 1972-2016. In this part, we look ahead at what would be needed to meet the PNZ report projections.
In Part 1 we used Federal Energy Regulatory Commission (FERC) Form 1 annual reporting data from 1972 to 2016, analyzed at the national level, to establish a historical context for annual growth in U.S. Investor-Owned Utility (IOU) investment in Transmission Plant in Service and annual transmission Operations and Maintenance (O&M) expenses.
In the first part of this article, we also provided a summary of forty years (1972-2016) of Form 1 data on transmission structure miles and determined that transmission structure miles grew at an average rate of between 0.6 percent and 0.7 percent a year during that time period.
 Bruce Williamson: We should be absolutely clear: Rapid expansion of transmission plant in service and inclusion in rate base is a two-edged sword – a boon for utility earnings on rate base and profitability, but not so for ratepayers. As the character Hamlet noted, “There’s the rub.”
In addition, we calculated that, per the Form 1 filings, each structure mile nationally in that period up to 2012 was associated with between two hundred sixty-one thousand and two hundred ninety-three thousand of transmission plant in real dollars.
This changes dramatically after 2012. Within the 2013-2016 interval, the transmission plant cost associated with each structure mile nationally increased almost four times faster than it had in the preceding forty years. If that burst of cost escalation for transmission investment continues, it is a concern for grid transformation cost projections.
We also noted in Part 1 that we used a simple trend to extrapolate from our 2016 transmission actuals to estimate our 2020 baseline to compare with the PNZ projections out to 2030 and 2050. This was based on the relationship between our structure mile proxy and transmission plant and expense to project what transmission plant and O&M would have to be in 2030 and 2050 if structure miles were to increase first by "~60%" and then "triple" to meet PNZ targets. April's Figure 1 provides the results.
As shown in April's Figure 1, the real transmission plant in service that is associated with over seven thousand structure miles is six hundred seventy-eight billion by 2030, which translates to a 10.6 percent annual rate of growth in transmission capital investment from 2020. Further, transmission plant capital investment must grow at an average annual rate of 9.8 percent every year from 2020 to hit the 2050 target of 1.3 million structure miles.
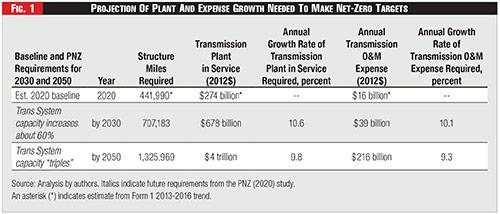 Figure 1 - Projection of Plant and Expense Growth Needed to Make Net-Zero Targets
The PNZ estimates of 2030 and 2050 transmission plant costs are far smaller than our estimates, such as, "total capital invested in transmission is three hundred sixty billion through 2030 and 2.4 trillion by 2050." The PNZ study estimate for 2030 is fifty-three percent less, and the 2050 estimate is fifty-seven percent less than our real transmission plant in service estimate shown in this issue's Figure 1 for those years.
We will say more below on this, but utility regulators and utilities alike know that transmission plant (along with the tremendous investment in distribution circuits and battery storage required) goes into utility rate bases and is entitled to cost recovery from ratepayers as soon as plant investments are deemed "used and useful."
We should be absolutely clear: Rapid expansion of transmission plant in service and inclusion in rate base is a two-edged sword — a boon for utility earnings on rate base and profitability, but not so for ratepayers. As the character Hamlet noted, "There's the rub."
Where the additional plant and transmission structure miles will be placed is another matter. Some studies and Congressional delegates have proposed that federal authority should be used to preempt permitting and CPCN authorities of the states, similar to the authority over interstate natural gas pipelines that FERC inherited from its predecessor, the Federal Power Commission. The practical equivalence is difficult to make. Pipelines are buried. Power lines are typically not.
 Branko Terzic: If our transmission cost growth approximations are reasonable, the possible increases in electric rates might exceed the general rate of price inflation experienced by consumers. Rate growth of this magnitude is certain to be contested in state jurisdictions in rate cases and before FERC in challenges to formula rates filings where possible.
An easy way to contextualize how much transmission mileage will be needed can be found by comparison with the U.S. Interstate Highway system. The interstate highway system has about forty-nine thousand miles of roadway in 2020.
Plans to use Federal interstate right of way, as well as federal and state-owned land, figure prominently in approaches to siting the new transmission system, because it is obvious from this issue's Figure 1 that the scale of new transmission capacity required vastly exceeds the amount of interstate roadway available.
In addition, significant stretches of the U.S. interstate system are poor candidates for siting based on the U.S. Centers for Disease Control's Social Vulnerability Index. Already impacted or vulnerable populations would face additional risks if neighboring interstate highway were to be used for transmission infrastructure. More work needs to be done by the DOE and consultants to square this circle.
Discussion
We have three comments based on these results, following a caveat on our method. We also have two important institutional considerations, which may affect the sufficiency and sustainability of the outcome, but these will appear with concluding remarks in Part 3 in the next issue of Public Utilities Fortnightly.

The caveat relates to our use of transmission structure miles as a proxy measure of generalized transmission capacity. This might overstate how much transmission plant is required to hit the 2030 and 2050 PNZ targets, particularly if total structure miles are mostly lower voltage structure miles in local distribution circuits.
Based on Form 1 historical national average, the majority of total structure miles are in the upper subtransmission and transmission voltage ranges. That is, about eighty-two percent of structure miles are 51 kV+; sixty percent of structure miles are 72 kV+ voltages; and forty-one percent of structure miles are 132 kV+ voltages.
It is safe to say that the grid transformations required to move large amounts of electricity into lower voltage local circuits for total building and transportation electrification will depend on voltages 72 kV and above. Although there may be some loss of generality by using the total structure mile proxy in our approach, it is a good first approximation until refinements are available.
Turning back to comment on Figure 1, our first comment is that sustained growth of electrical infrastructure and its operating expense at this rate and magnitude would be unprecedented, as would be the necessary increases in the price of electricity to pay for it. With very few exceptions over several decades, electricity rate increases have not kept up with the Consumer Price Index (CPI) (Mitnick, 2024).
If our transmission cost growth approximations here are reasonable, the possible increases in electric rates might exceed the general rate of price inflation experienced by consumers. Rate growth of this magnitude is certain to be contested in state jurisdictions in rate cases and before FERC in challenges to formula rates filings where possible.
Both regulators and legislators should not forget the lessons from use of billing moratoria imposed during COVID, or the use of rate freezes for up to ten years by some states to hold off rate hikes twenty years ago. Customer bill moratoria and rate freezes postponed but did not eliminate recovery of prudently incurred costs owed to the service provider.
Moreover, ratepayers and regulators have heard for a decade that renewables and the grid transformation will bring savings and will be affordable. These expectations could become discontents merging with others related to facility permitting, fairness of cost allocations, and insufficient attention to social equity. These discontents can easily undermine commitments to long-term policy prescriptions.
Our second comment relates to unfamiliar project risk faced by financial markets. The financial markets and the rating agencies need to get it right, because the amounts involved and lingering reminders of the 2008-2009 Great Recession are not easily forgotten.
Financial markets have gotten utility markets wrong before (Enron, MCI-Worldcom). There is considerable potential for guessing wrong about future outcomes by developers and lenders, as well as the federal and state governments, because of technological complexities, regional and state differences, human behavior, and the passage of time.
Lenders who look at the risk exposure and the new opportunities created by the Inflation Reduction Act (IRA) have moved off their market optimism of early 2023 and now express caution at developments in financial markets.
To counter this, the 2023 IRA allowed DOE to serve as a transmission line "anchor customer" by taking up to fifty percent ownership in firm transmission capacity for up to forty years. This is in addition to other derisking measures to reassure financial markets, such as loan guarantees and tribal incentives for siting.
These derisking steps for financial markets are similar to the measures taken by the federal government during the 2009 GM bankruptcy, although the GM financing of thirty-three billion is a tiny fraction of the amounts required for the transmission transition discussed here. Whether and when the federal government could extract itself profitably from transmission ownership commitments like the way the Treasury Department unwound the GM stock commitment is another consideration.
Our last observation relates to the headlong pace and what may be an absence of transparency about requirements and cost. Indeed, the questions unanswered led the authors to this research.
We are faced with complex models and discussions of which model is better at one aspect or another of prediction, but there is something about the quantitative style that gives the illusion of exactitude about the future. As Vaclav Smil and many others have noted, forecasts made so far into the future are worthless.
We are making a commitment to a transmission system makeover for which no one has a very convincing grasp of the economics of implementation, deployment, and operation. As an example, cost estimates from various expert sources and sophisticated modeling tools are widely different.
This reminds the authors of the spiral or concurrent development concept sometimes used in major public acquisition programs. For example, large complex undertakings are initiated before the technology or manufacturing capability exists, in the hope these capabilities will be developed at some point after the project is underway.
As the U.S. Government Accountability Office has demonstrated in repeated studies of government procurements, these situations are recipes for cost and schedule overruns and lowered performance of the eventual product.
In the present context, one example is affordable utility-scale long-term battery storage. It is absolutely essential for a grid built around intermittent generation sources to integrate with large amounts of storage.
Affordable storage in sufficient quantity offers grid support that replaces fast ramping fossil-fueled generators and provides reliability and system resilience. The reality is that current implementations of larger scale long-term battery storage are exorbitantly expensive and lack performance except in brief intervals. Much development work remains to be done.
Supposing that affordable utility-scale storage finally arrives, it is likely that other parts of the overall transformation may already be in service. This results from the headlong pace set by the target dates with little regard for the economics or maturity of the necessary technology.
This is the risk within the false promise of spiral or concurrent development: when the needed technology or method eventually arrives, there is often wasted effort, retrofit and rework, because other systems could not be held up waiting for one or more laggard technologies or manufacturing capabilities.
Summary
To summarize Part 2, we have developed quantitative estimates of the possible transmission plant and transmission O&M that would be required to support the PNZ calculation of transmission system expansion to meet the electrification and net-zero decarbonization targets.
We acknowledge there is a possibility of overstating or understating the amount of transmission plant needed. In either case, it is our view that the projected additional investment is absolutely unprecedented and will necessarily impact ratepayers with annual or nearly annual rate adjustments. Policy instabilities could result as state and federal legislators and regulators respond to electricity bill payers unprepared for these price increases.
In Part 3 we will conclude with two important institutional concerns that may develop connected with the role of FERC and State Regulatory Commissions in the grid transformation process.
