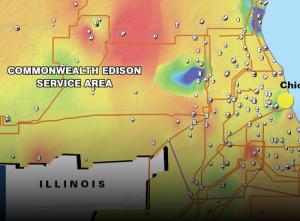
What did LMPs tell us this summer in PJM's new neighborhood?
Aaron Brasket is the director of Energy Velocityʼs latest product, EV Weather; Tom Ottem is senior project manager at the company; and Mike McNair is director of EV Market Ops.
With one summer under its belt as a member of PJM, ComEd has been called a complete success by some, boring by others. On the whole, prices in the region were quite flat, and spreads between the 1,281 price nodes in the region were small to non-existent. In fact, the best opportunity for a generator to make money in this market was to export power to a neighboring market.

Some of the lack of action this summer surely is due to the fact that it was a cool summer. But from a transmission perspective, it's clear that ComEd was a well-oiled machine. Using data from Energy Velocity's Market Ops and Weather products, we can see the impact of transmission and weather on ComEd this summer.
ComEd's LMP Market
ComEd became part of PJM last May, adding 1,281 new pricing points to the region. To simplify the analysis, we will focus only on peak prices from the real-time market between June and August.
First, the average ComEd zonal price of $40.24, which is a weighted average price for the entire ComEd zone, was 30 percent lower than the equivalent zonal average in PJM of $57.24, shown in Figure 1. Neither market was particularly volatile, but ComEd was as much as 30 percent more volatile than PJM.

